Short answer
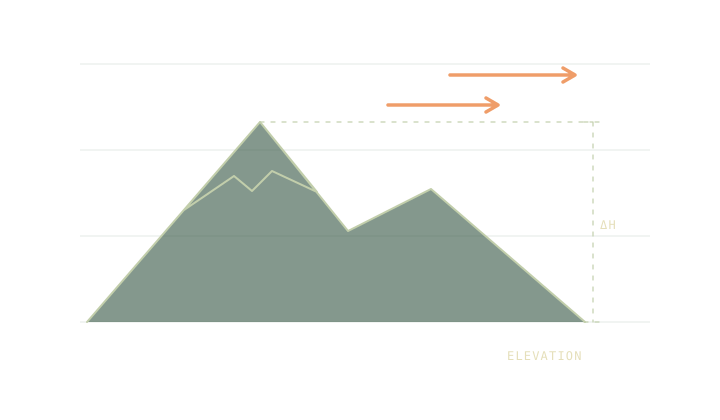
Check forecasts for the places and times where conditions change the trip. Look at the elevation and location the forecast represents. A selected point can sit in a grid cell that includes both the summit and lower ground. Use the official warnings and compare the trailhead, exposed leg and return.
On this page
Start with the leg that can change the plan
Use the map to identify the places where weather matters most: an exposed ridge, a high pass or a crossing near the return. Compare the forecast for those places at the times you expect to reach them. The day hike timetable helps connect the weather check to a clock time rather than the day’s single highest temperature.
The National Weather Service grid explanation notes that a point forecast can represent a cell containing a mountain without corresponding exactly to its summit elevation. Read the coordinates and elevation displayed by the forecast source. A result that says “near the summit” may still need context about the terrain around the selected point.
Use a lapse rate as a comparison
In a worked scenario, a trailhead at 700 m is 14 °C and the destination is 1,900 m. The difference is 1.2 km vertically. At 6.5 °C per kilometre, the scenario subtracts 7.8 °C and gives 6.2 °C. That calculation isolates one assumption and can be reproduced in the Altitude tool.
The lapse rate guide explains why an actual forecast or observation can give a different number. Avoid automatically applying a second lapse-rate adjustment to a forecast that is already represented at a higher elevation. Use the rough comparison to spot an assumption that deserves checking.
Read the variables separately
A colder destination is only one part of the comparison. Check wind and gusts, precipitation, visibility and official advisories. If thunderstorms could affect an exposed section, read the lightning safety guide and follow current alerts and local guidance. A temperature estimate cannot settle that route decision.
The Feels like tool can put wind chill or heat index assumptions next to the air temperature. It is useful only in the model’s own range. Compare the actual wind exposure, clothing and ground conditions separately. For a route returning near dark, check the usable light deadline as well as the temperature after sunset.
Keep the time and source on the note
Write the forecast source, issue time and the location you read. Note which change would make you turn back, postpone or take a lower alternative. A printed figure loses its value quickly when its time and place are missing. Give the group a way to know which forecast they are using.
Recheck official information before leaving. If a condition remains uncertain and the difficult leg offers few exits, choose the plan that remains workable under the supported range of conditions. Leave the forecast note with the route so the decision can be reviewed at the next checkpoint.
Make a second forecast check for the alternate route if it changes elevation or exposure. A plan to stay lower may avoid a ridge, while adding time in a valley or crossing a different watershed. Verify the specific benefit you expect from that change.
Common questions
Is a point forecast a reading from that point?
It represents forecast conditions for an area or grid location. Check the displayed elevation and use observations and warnings alongside the forecast.
Does a fixed lapse rate work for every forecast?
Use a lapse rate only as a scenario. The actual vertical temperature profile can differ, including during inversions and local weather changes.
Sources
- National Weather Service point and grid forecast explanation
- National Park Service trip planning guide
- Trailwright model and assumptions
Published 9 November 2026. Reviewed 9 November 2026. Sources support the figures quoted; they do not endorse Trailwright. Report a correction through the owner’s contact page.